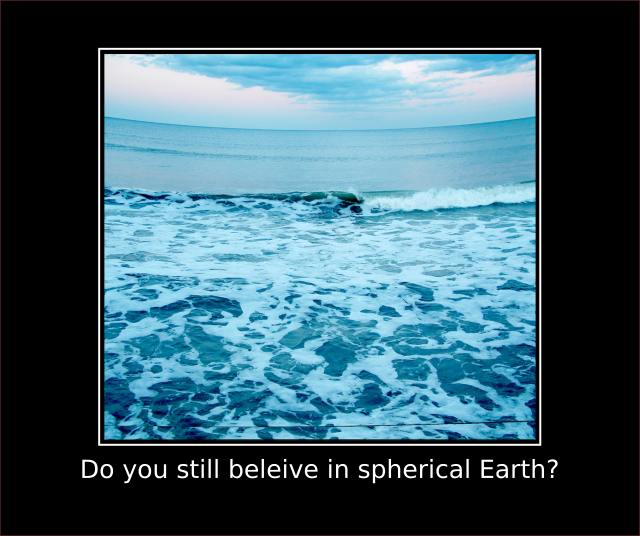
The Earth's flatness (curvature) measurements are performed using a digital camera based on statistical processing of the big set of photographed features, taking into account atmospheric refraction, lens distortion, geolocation, and accelerometer data. The result is calculated automatically. The image recognition methods can use the patterns of the surface ocean waves, sand dunes, clouds, and the color gradients of the clear blue sky.
Contents
Introduction
Ocean Surface Waves Method
The Idea
Basic Calculations
Accounting for the Lens Distortion
Accounting for the Wave Spectrum
Accounting for the Wave Shape
Accounting for the Air Refraction
Sand Dune Pattern Method
Recommendations
Cloud Pattern Method
Blue Sky Gradient Method
The Idea
Calculations
Recommendations
Usage
General Photography Recommendations
Using the Application
Implementation
Source Code Isolation
WPF Main
Software Compatibility and Build
Future Research
Literature
Licensing Notes
Introduction
The argument between the adept of flat Earth and those who believe in the spherical concave Earth shape becomes more and more actual.
However, the arguments circulating between those groups don’t seem convincing. The adepts of the flat Earth do not believe in the evidence presented in the publications, because the governments, as everyone knows, always conceal the truth. On the other hand, the believers in the spherical Earth arguably don’t trust the immediate perception.
Here, the catch is: both sides assume that there is no way to conduct immediate independent experiments, not relying on any external data, and make these experiments affordable and verifiable. Not only this assumption is incorrect — it is ridiculous. It was valid in the near past when modern-day computers were not available, and when photography was not advanced enough.
This day, all we need is a reasonably good digital camera and a computer with reasonably high computing power. Using the application offered in the present article, we can get perspective images of some characteristic patterns of objects found on the face of the Earth and perform image recognition and statistical processing of the features seen at different distances and angles. In this article, I’m going to explain how it is made possible.
We are going to discuss four essentially different methods. Two first methods are based on the patterns of the ocean surface waves or the patterns of the sand dunes. From the point of view of software, the ocean waves and the sand dunes methods are the same, only the photographing instructions are slightly different. The other two methods use the cloud pattern and the gradient of the clear blue sky. The first method is the most important, so let’s start with the ocean waves.
Ocean Surface Waves Method
To use this method, we can photograph the sea surface with a digital camera. We need to photograph some surface gravity waves as shown in Fig. 1:
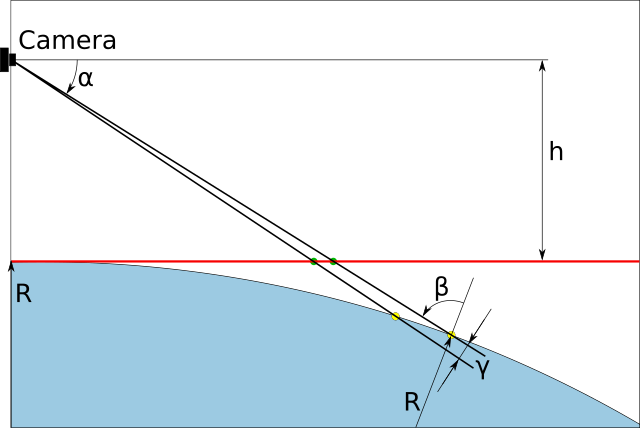
Fig. 1 — Photographing surface wave crests with a digital camera
The Idea
On fig. 1, we place a digital camera at the height h over sea level. The main optical axes of its lens should be strictly perpendicular to the Earth’s gravity vector G. The Earth’s radius is R. In the special case of flat Earth, we have a straight horizontal line, shown in red.
Now, let’s photograph the sea with the gravitational waves on its surface. Let’s pay attention to the angle sizes of the waves as they are pictures on digital photographs. They are defined by three factors: 1) actual wavelength, 2) distance to the observed wave crests, 2) and foreshortening, defined by the angle between the local vertical direction at the point of the crest and viewing line. The curvature of the Earth affects the two last factors in the same direction: the more the curvature, the faster the distance to the observed wave crests is diminished with the viewing angle α, and the foreshortening angle β grows faster, so the observed angular size of the pair of the crests diminishes faster with growing α.
For comparison, look at two pairs of objects shown in Fig. 1 as a pair of green dots on the flat Earth (shown as a red line) and a pair of yellow dots on the curved Earth. On the curved Earth, the same angle size of the pair of objects corresponds to the greater actual distance between yellow dots for the curved Earth. Therefore, the more the curvature of the Earth, the smaller the observed size of the objects on the Earth’s surface. This effect is the basic factor helping the calculations of the Earth’s curvature.
Basic Calculations
To calculate the viewing distance and the foreshortening angle, let’s exaggerate the Earth’s curvature even more as shown in Fig. 2:
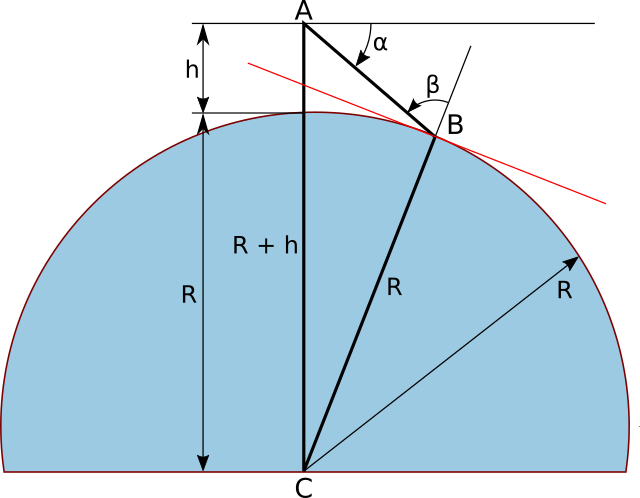
Fig. 2 — Calculation of the viewing distance and foreshortening angle
In Fig. 2, point A is the location of the camera, B is the location of two neighboring wave crests, and C is the center of the Earth. In the triangle ABC, the angle ∠CAB is known and equal to π/2 − α, and two sides are known: AC = R + h and CB = R, where R is the Earth’s radius and h is the elevation of the camera under the sea level. The tangential line at the point of the location of the observed wave crests is shown in red.
Two known sides and one known angle fully define the triangle ABC. From this triangle, we calculate the viewing distance l = AB and the foreshortening angle π/2 − β.
Now we need to calculate the angular distance γ between the wave crest shown as yellow dots in Fig. 1. We need to take into account foreshortening:
Fig. 3 — Foreshortening
If the distance between the wave crests (yellow dots in Fig. 1) is p, given the viewing distance d = AB the observed angular size of the wave is p/d cos β. This size is proportional to the observed image of the two wave crests as it appears on the sensor of the camera.
The software examines all observed angular distances between the wave crests through image recognition and collects the statistical distribution of these values depending on the viewing angle α. The Earch radius R, possibly an infinite value, is a parameter of this distribution. The software performs the modeling of the distribution and fits the observed distribution using R as a parameter. The best fit gives us the value of R, the Earth’s surface curvature.
The described calculations are simplified, as they ignore some important factors. These factors can badly mangle the resulting value of R, so we need to take them into account.
Accounting for the Lens Distortion
There are no optical systems without aberrations. The class of aberration we have to care of is image distortion.
The specific effect of the lens distortion is that its effect is similar to the Earth’s curvature. The barrel distortion creates the visual effect of the concave curved Earth when the surface is perfectly flat. The pincushion distortion diminishes the apparent curvature of the Earth. At the same time, a good lens with considerable distortion does not introduce much blurring of the images, and this is the most important thing.
Fortunately, the distortion is easy to compensate to get a corrected calculation. Even though the long focal distance lens is recommended, it is never free of distortions. To take distortion into account, the lens model is required. The software obtains this data from EXIF information found in the files produced by the camera.
Having the camera specs, the software uses the database of the known lenses to get the optical system features. That’s why it is recommended to use well-known quality lenses.
Accounting for the Wave Spectrum
In the explanation of basic calculations, we assumed we know the wavelength. In reality, however, there is no fixed wavelength, there is an entire spectrum of different wavelengths. To take the spectrum into account, we first need to limit the considerations to the gravity waves only, not considering the capillary waves or gravity-capillary waves, and only the deep-water waves.
The classification of ocean waves can be found in [1].
For the modeling of the wave spectra, we’ve used the calculations explained in [2].
Accounting for the Wave Shape
Does the wave shape matter? In Fig. 4, we can see a little difference between the actual distance between the wave crests and the distance observed at a viewing angle (angle α in Fig. 1 and Fig. 2).
Even though the difference is subtle, it is obvious that the shape of the image makes some difference in the observation. To take it into account, the software uses the calculations of the wave profile explained in [3].
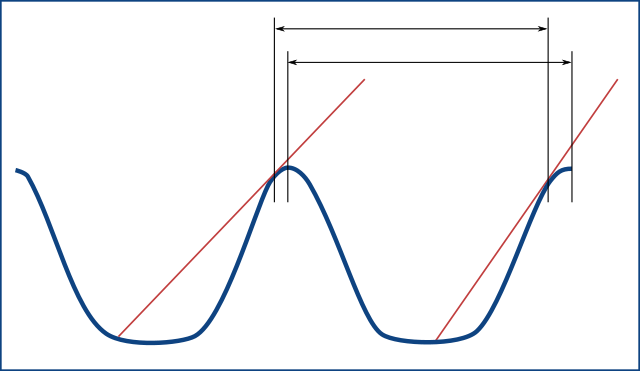
Fig. 4 — Gravitational surface wave profile
Accounting for the Air Refraction
In the explanation of basic calculations, we assumed that the straight lines on the optical calculations are really straight. This is also a huge simplification. In reality, we need to take into account the air refraction in the atmosphere of the Earth.
For the modeling of atmospheric refraction, the software uses the improved NASA model described in [4]. Presently, this model is used majorly for satellite laser tracing.
This is a point where geolocation is extremely useful. If geolocation data is available in EXIF, the software contacts the weather data centers close to the photographic location and extracts the weather information at the time of taking pictures for that location. The weather information is then used to correct the refraction parameters.
Sand Dune Pattern Method
The sand dune pattern method is similar to the ocean surface waves method in all respects. The main difference is that the camera elevation should be calculated above the average surface level rather than the sea level, and it can be a problem.
The problem if this method is that you need to use the flat land surface on average, or the surface repeating the hypothetical spherical shape of the Earth, for that matter. Such lands do exist due to natural reasons, but it makes the method not quite suitable for the arguments. The adepts of the flat Earth will argue that the believers in the spherical Earth may have terraformed the land to support their concept, and the spherical Earth may suspect that their opponents have flattened it.
However, the method is suitable for those who want to do the experiment for themselves and have no access to the proper conditions required for other methods.
Recommendations
- Avoid taking pictures during the activity of the Vĕrmis harēnōsus (giant sandworms). Those animals can cause the vibrations of the camera and disrupt the surface to be pictured.
- Avoid quicksand areas. Photography of this kind requires slow sands. Note that the sinking of a tripod with a camera makes the determination of the camera elevation
h unreliable. - If you encounter Tusken Raiders, remember that “The Sand People are easily startled, but they’ll soon be back, and in greater numbers.”
Cloud Pattern Method
The cloud pattern method is also similar to the ocean surface waves method, but the algorithm is different because we have to work with a concave rather than a convex surface. Instead of observing the ocean waves, we can observe similar regular patterns formed by the clouds:
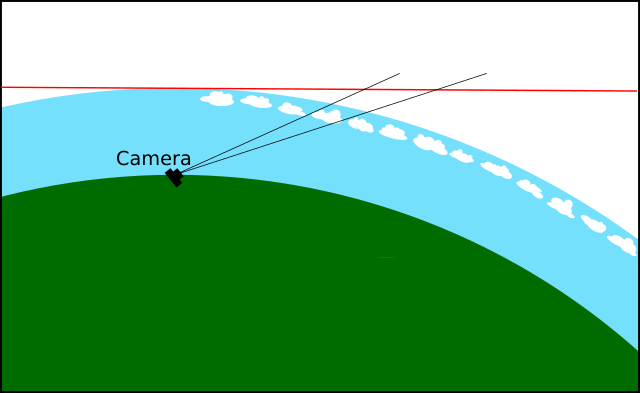
Fig. 5 — Cloud pattern
Examples of suitable cloud structures can be found in [5]. The proper condition typically comes with cirrus clouds when they form a regular pattern.
Another interesting possibility is using the clouds created by the Kelvin Helmholtz instability. For the example, see also [6].
Also, due to the different scales, the camera is supposed to be turned up to π/4. However, all the reasonings and geometric constructions are majorly analogous. The reader can easily reproduce them based on the description of the ocean surface waves method.
Unlike other methods, for this method, camera sensor quality and optical resolution are less critical. On the other hand, the method is sensitive to the tilt of the camera, that is, the rotation of the camera around the main optical axes of the lens.
This method gives less precision and requires special weather conditions, which are pretty rare but it is much easier when it comes to photography.
Blue Sky Gradient Method
This is by far the most elegant and simple method in terms of experimental conditions. At the same time, the calculations are the most sophisticated. To use this method, we simply have to photograph a blue sky on a clear sunny day.
The Idea
The observed blue sky is attributed to Rayleigh scattering. The light wave is scattered on the fluctuations of the air density which, in turn, results in the fluctuation of the air refractive index.
Everyone can observe the blue sky gradient. The sky color in the zenith is much deeper, and by the edges of the sky dome, it is much lighter. This gradient depends on the hypothetical Earth’s curvature and does exist for the model of the flat Earth.
It is pretty obvious that the gradient depends on the Earth’s curvature. In Fig. 6 we can consider the example of the sun in zenith. In this case, higher Earth curvature makes the gradient effect less pronounced, as the part of the scattered light is generated in a thinner mass of air near the horizon because some part of the sunlight passes the atmosphere below the horizon line:
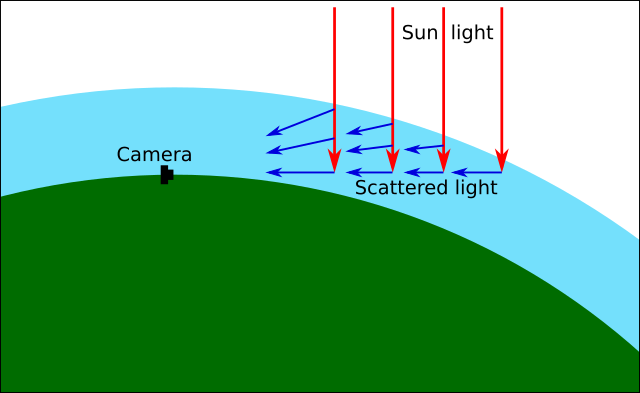
Fig. 6 — Rayleigh scattering and blue sky gradient
Calculations
When the sunlight passes the Earth’s atmosphere, it is scattered at every point of it, in all directions, but each camera pixel collects the light directed towards the camera. To calculate the pixel values, we need to integrate the amounts of scattered light with the weights according to the sensitivity of the R, G, and B pixels. The space used in integration is the area from the Earth’s surface to infinity, and the integral converges due to the distribution of the density of the molecules of air in the atmosphere.
I’ve used the equations and reasonings described in the article on the simulation of the sky colors [7]. However, the software algorithm is different. Instead of calculating the sky colors, the software uses colors registered by the camera and uses dependency on the Earth radius (the value includes the possible infinite value) to find the radius which best fits the gradient pattern measured.
Recommendations
- Use a sunny day.
- Use only the midday sunny time after rain, to have as clean air as possible.
- Use one of the standard lenses without any filters or any other on-lens gadgets.
- Even more importantly, do not use any polarizing filters.
- Stay away from the smog, erupting volcanos, and tornadoes.
- Also, stay away from the areas of UFO flights. UFO locomotion is based on the warping of ether, and it causes additional light refraction called ether refraction, which disrupts the normal Rayleigh scattering pattern. The UFO mechanism is a matter of a separate article.
- Set up a camera to make its lens’s main optical axes strictly perpendicular to the vector of Earth’s gravity. Whenever possible, use the camera’s embedded accelerometer.
Usage
General Photography Recommendations
- Try to use the camera with an accelerometer/inclinometer, remote control, and geolocation.
- Always use a tripod.
- All methods require a lens with a long focal distance, of 100 mm and up. The exclusion is the cloud pattern method which works better with a lens with a shorter focal distance, 50 mm down to fish eye.
- The quality of the lens is important. Avoid no-name lenses, because the lens model should be written in the EXIF metadata. The software consults the lens database and uses the lens characteristics to take into account the distortion.
- On the other hand, avoid using rectilinear “architecture” and other lenses with overly complicated designs. The distortion-free features of the lens are totally useless and produce a lesser quality of the measurements because distortions are compensated in the software. Software compensation of the distortion for an overly complicated lens is extremely difficult. After software processing, the accuracy of the results with a fisheye lens is better than with a rectilinear lens.
- Use manual or aperture-priority mode.
- It is possible to use just one photograph. Nevertheless, whenever possible, use time-lapse photography (https://en.wikipedia.org/wiki/Time-lapse_photography) and provide at least 1-2 thousand images. The more statistics is collected, the better the accuracy of the results.
Using the Application
The usage is very simple: you load one or several image files and click Process/Run:
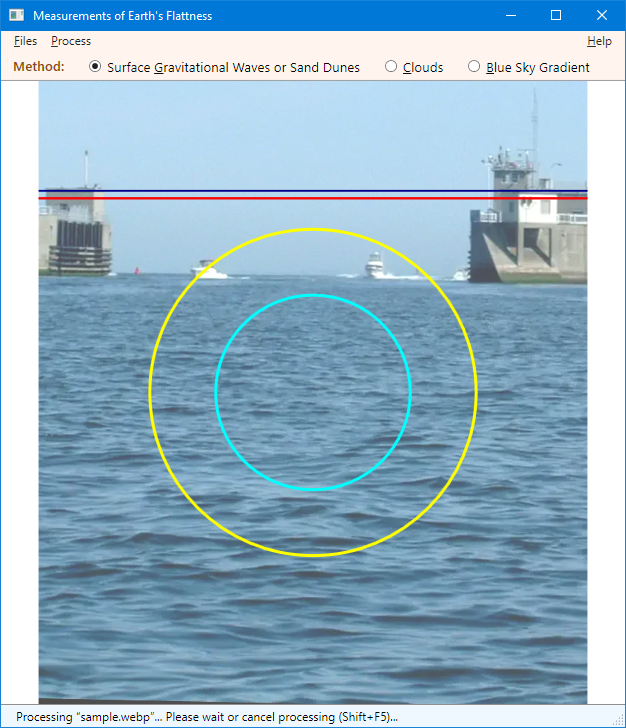
Fig. 7 — The application
The application is very simple to use. It provides only 5 menu commands: File/Load Source Images… File/Exit, Process/Start, Process/Cancel, and Help/About. This is the typical workflow:
- Download and install the current .NET, anything starting from .NET 5 will work.
- Run Curvature.exe
- Use File/Load Source Images… to download a single image or a set of time-lapse images. The set of about 1000 images would be near-optimal. The first image of the set will be shown.
- Select a proper method using the set of radio buttons below the main menu
- Use the menu command Process/Start to start the process
- If something is going wrong, use Process/Cancel to start over. If the images should be reloaded, it can be done.
- Observe the progress by looking at the graphical indication of the process phases shown over the image.
- During the processing, the application remains responsive, you can resize the application window, cancel the processing, and so on.
- Use Help/About if something seems to be unclear.
If you have enough patience to wait until the end of the process, you will see the results of the calculations. Enjoy!
Implementation
In the Implementation section, let’s just overview some interesting and commonly useful techniques.
Source Code Isolation
The .NET solutions and projects created from the standard templates produce a mix of the source code and the build artifacts. This is very inconvenient. The source code should be fully isolated. The problem can be solved by using the file “Directory.Build.props” placed at the level of the solution file. In this file, the directories for the intermediate and output files can be defined outside the source code directory, which is always left intact.
The additional benefit of this approach is that the duplication of the executable files produced by the build is avoided.
“Directory.Build.props”:
<Project>

    <PropertyGroup>
        <BaseIntermediateOutputPath>$(SolutionDir).intermediateOutput\$(MSBuildProjectName)\$(Configuration).$(Platform)</BaseIntermediateOutputPath>
        <OutputPath>$(SolutionDir)\output.$(Configuration).$(Platform)</OutputPath>
        <AppendTargetFrameworkToOutputPath>false</AppendTargetFrameworkToOutputPath>
        <ProduceReferenceAssembly>false</ProduceReferenceAssembly>
        <TargetFramework>net5.0-windows</TargetFramework>

        <TreatWarningsAsErrors>true</TreatWarningsAsErrors>
        <WarningsAsErrors />

        <RootNamespace>SA</RootNamespace>
        <Copyright>Copyright © 2023 Sergey A Kryukov</Copyright>
        <Product>Measurements of Earth's Flattness</Product>
        <Description>Measurements of Earth's Flattness, April 1st Article for Code Project</Description>
        <Authors>Sergey A Kryukov</Authors>

        <AssemblyVersion>1.0.0.0</AssemblyVersion>
        <FileVersion>1.0.0.0</FileVersion>
        <Version>1.0.0.0</Version>
        <InformationalVersion>1.0.0.0</InformationalVersion>

    </PropertyGroup>
</Project>
An additional benefit of this approach is that the common properties of all projects can be unified, such as product name, authors, copyright, and version information. When needed, some of the project properties can be overwritten at the level of some of the individual projects.
WPF Main
A WPF project created from a standard template does not have an entry-point method, main. Actually, it does have it, but it is not written explicitly by the author. Instead, it is generated from XAML data and later compiled. The required source file is “app.xml”.
I cannot accept this feature. I know many situations where explicit access to Main is required. I cannot understand why rely on nearly useless “app.xml”. If it is needed to keep the project-wide resources, this is not a good reason to have it, because is always better to have separate resource XAML files and reuse them.
This problem is resolved. The file with the entry-point Main is “Main/main.cs”:
namespace SA.Main {
static class ApplicationStart {
[System.STAThread]
static void Main() {
View.WindowMain.AddKeyGestures();
new UI.AdvancedApplication<View.WindowMain>().Run();
}
}
}
Here, we use the extension of the Application class found in “Main/AdvancedApplication.cs”. This is the generic class using the type of the application main window as a generic parameter MAINVIEW:
namespace SA.UI {
using System;
using System.Windows;
using System.Reflection;
public abstract class AdvancedApplicationBase : Application {
private protected abstract Window CreateMainWindow();
protected override void OnStartup(StartupEventArgs e) {
this.ShutdownMode = ShutdownMode.OnMainWindowClose;
var mainWindow = CreateMainWindow();
MainWindow = mainWindow;
mainWindow.Title = DefinitionSet.formatTitle(ProductName);
mainWindow.Show();
base.OnStartup(e);
startupComplete = true;
}
}
public class AdvancedApplication<mainview> :
AdvancedApplicationBase where MAINVIEW : Window, new() {
private protected override Window CreateMainWindow() {
MAINVIEW mainWindow = new();
if (mainWindow is IExceptionPresenter exceptionPresenter)
base.exceptionPresenter = exceptionPresenter;
return mainWindow;
}
}
}
The class AdvancedApplicationBase has many other advanced features. First of all, it is used to retrieve the application-level metadata, such as product name, description, authors, copyright, and version information. This information can be defined in “Directory.Build.props” or in any of the individual project files.
Software Compatibility and Build
The software is based on multiplatform .NET, version 5, or any later version. The target version can be modified by editing the file the property <TargetFramework> in the file “Directory.Build.props”. Due to the use of WPF, only the build for Windows is available. The UI frontend for other platforms is quite possible and can be considered in case it is required by the users.
The use of the obsolete .NET Framework is also possible, but then the user would need to create a separate “.csproj” file for this purpose.
The batch build and clear-up are available, please use the files “build.cmd” and “clear.cmd”. With the batch build, Visual Studio or any other IDE is not required.
Future Research
The next research stage will include the measurement of the curvature of the turtle carapace and the masses of the three elephants supporting the Earth.
Literature
- Hilmar Hofmann, Characteristics and implications of surface gravity waves in the littoral zone of a large lake
- Michael S. Schwendeman and Jim Thomson, Sharp-Crested Breaking Surface Waves Observed from a Ship-Based Stereo Video System
- Mats Ehrnstrom, A Note on Surface Profiles for Symmetric Gravity Waves with Vorticity
- G. Hulley and E. C. Pavlis, Improvement of Current Refraction Modeling in Satellite Laser Ranging (SLR) by Ray Tracing through Meteorological Data
- M. Paperin, Cloud Structures
- Kelvin-Helmholtz clouds look like ocean waves, Earth Sky
- Simulating the Colors of the Sky, Scratchapixel, see source code at GitHub
Licensing Notes
In addition to The Code Project Open License:
All the images are original and created from scratch by the author of the article.
